Regularly auditing PPC accounts you manage ensures that you’ve got a close eye on how campaigns are performing and if your settings/structures are meeting best practices. Audits can quickly flag issues with important key metrics and help you identify adjustments that need to be made before results spiral out of control.
When you’re managing multiple accounts (or possibly even multiple accounts for multiple clients), it’s easy to get bogged down in finding individual elements that may need adjusting. Automating your account audits can help reduce the time you spend managing accounts and increase the time you spend optimizing. It can also give you peace of mind that your campaigns and account settings are set properly.
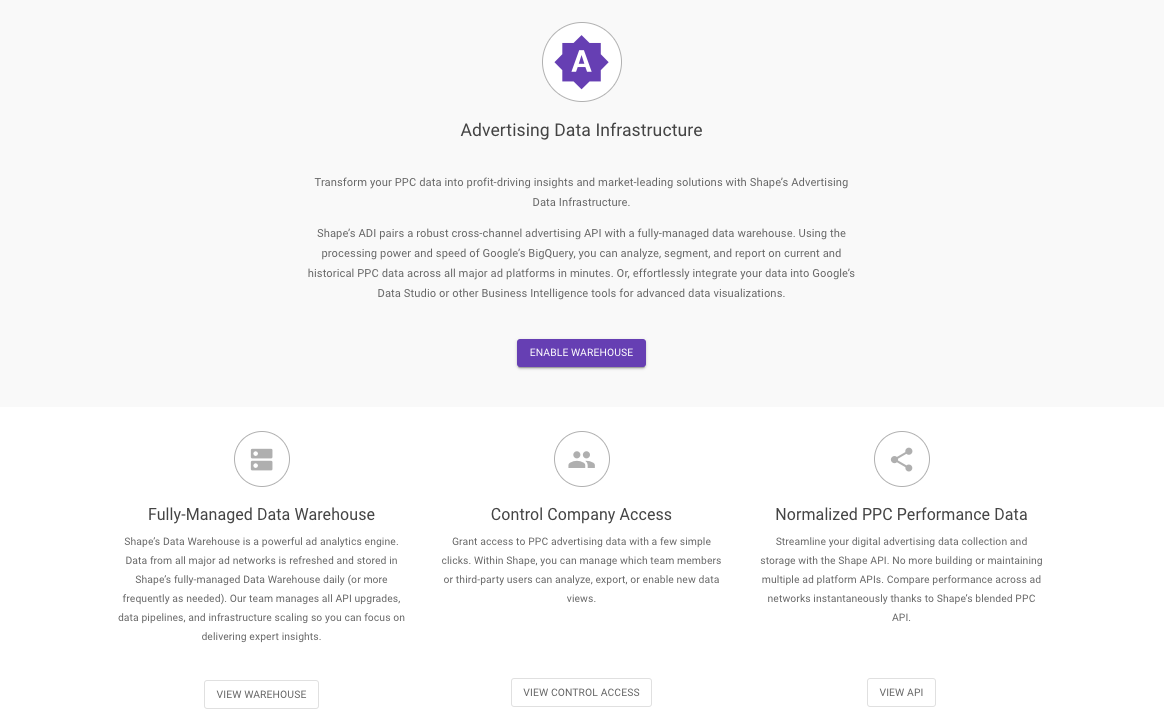
Unifying all your PPC data in one place is an important first step in automating your audit process. Shape’s Advertising Data Infrastructure does just that by aggregating and storing all of your company’s current and historical, cross-network PPC data together in a managed data warehouse. With that data in hand, you can run performance metrics and campaign settings against a series of checks to see whether you are acing (or failing) your audit criteria.
With the Shape ADI, it’s possible to build a scalable auditing tool for all of your ad accounts and clients using free reporting tools such as Google Data Studio.
Select What to Audit
Choosing which elements in your PPC accounts to audit regularly is an important first step in building an automated auditing tool. If you flag performance issues using a manual PPC audit checklist or a marketing agency reporting tool, you’ve got a great head start.
That being said, we highly suggest you pick four to five key elements you want to audit first. Trying to automate your entire audit all at once without laying the proper foundation may result in frustration.
For this example, we chose to audit:
1. Performance by Device Type
2. Performance by Ad Type
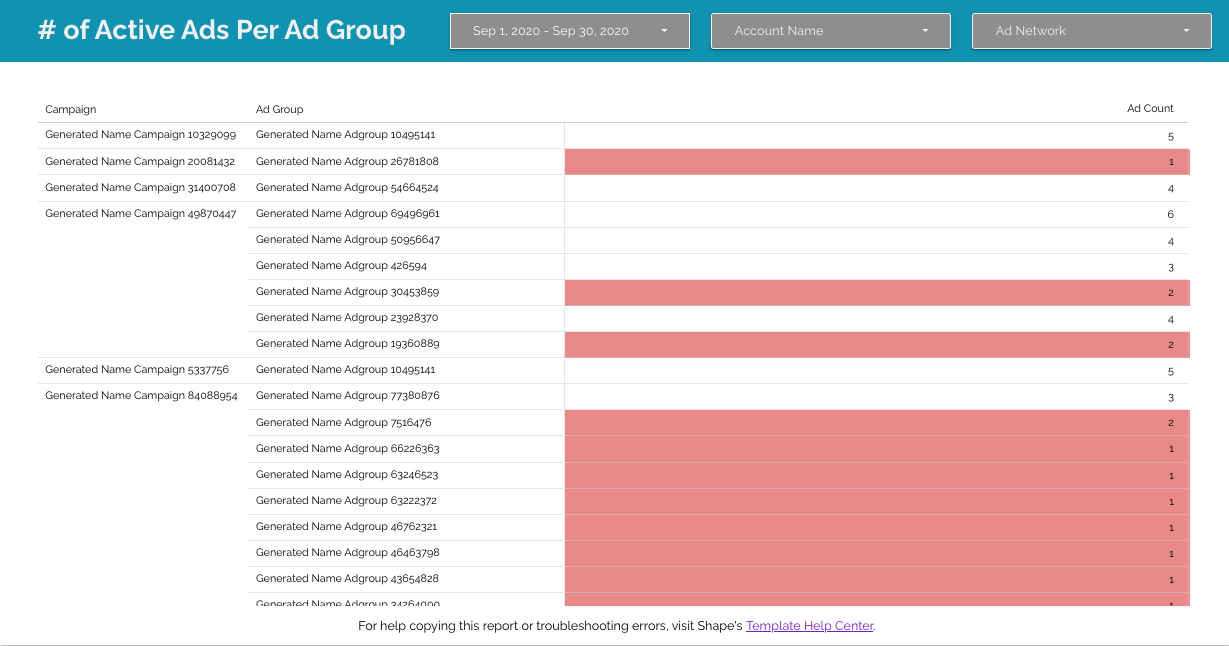
3. # of Active Ads Per Ad Group
4. # of Active Ads Per Ad Set
5. Search Terms
Get the Data
The key to running a PPC audit is lots of data. Previously, audits may have required PPC advertisers to assemble all the necessary data manually across ad platforms or build their own audit tools using costly-to-maintain API integrations.
Shape’s Advertising Data Infrastructure was built to do all the heavy lifting of collecting, normalizing, storing, and transferring advertising data into (and out of) a fully-managed PPC data warehouse. Instead of needing months of engineering time to data needed to build tools, digital advertisers and agencies can simply enable an ADI and have access to months of PPC data refreshed daily (if not more frequently).
To get PPC data from up to five ad platforms and seven ad networks flowing into a BigQuery data warehouse, follow the steps below:
2. During the onboarding process, add your Google Ads (incl. Youtube), Facebook Ads (incl. Instagram), Microsoft Ads, Twitter Ads, and LinkedIn Ads.
3. Optional: Create Clients and Budgets in Shape. You can combine campaigns into unique groupings to track spend and metrics in whichever combinations you choose.
4. On the main dashboard, click ADI. On the ADI page, click “Enable Warehouse.”
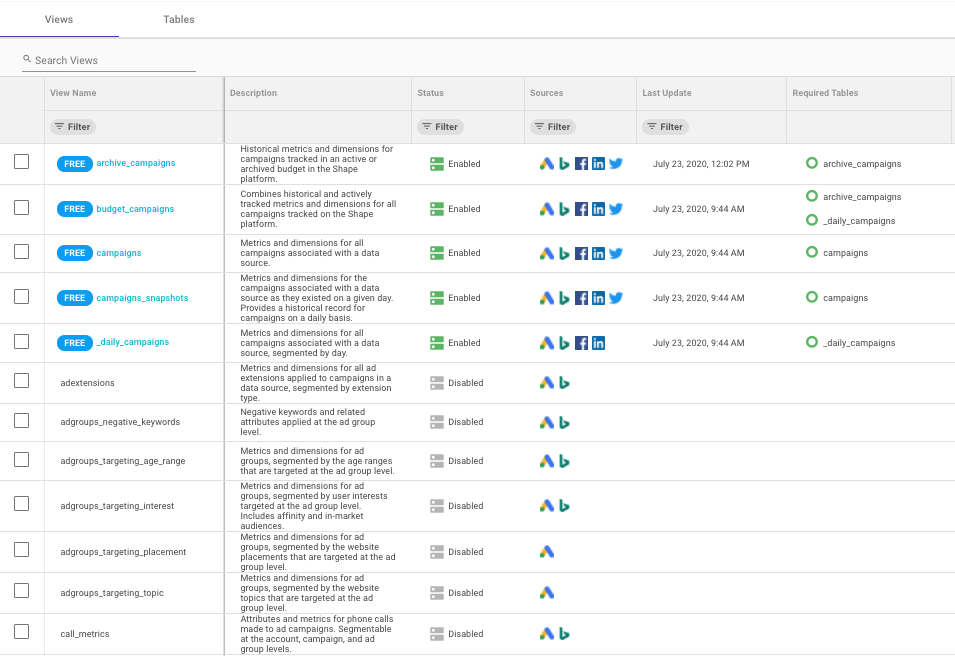
5. Shape will automatically generate a BigQuery data warehouse for you and enable five always-free campaign-level data views.
Shape offers 5 always-free campaign level views for anyone using Shape. However, for our audit we wanted to dive deeper into data below the campaign level. We utilized the following 5 premium views (see step 7 to enable) for the example audit template:
1. _daily__device_campaigns
2. _daily_ads
3. _daily_adgroups
4. _daily_adsets
5. search_terms
Build Audit Templates
Not only is Google Data Studio an excellent, free external reporting tool for PPC advertisers, it can be also used to build internal auditing tools as well. Before you start building any audit template, follow the directions in section two above to get multi-channel PPC Data from the Shape ADI into Google Data Studio.
Typically, the ad account audits we’ve seen combine performance reports/analyses along with systems/settings checks to ensure campaigns are set up and operating correctly. We’ve already launched this helpful guide on how to Build Automated PPC Reporting with Shape ADI which may be helpful as you are building an auditing tool.
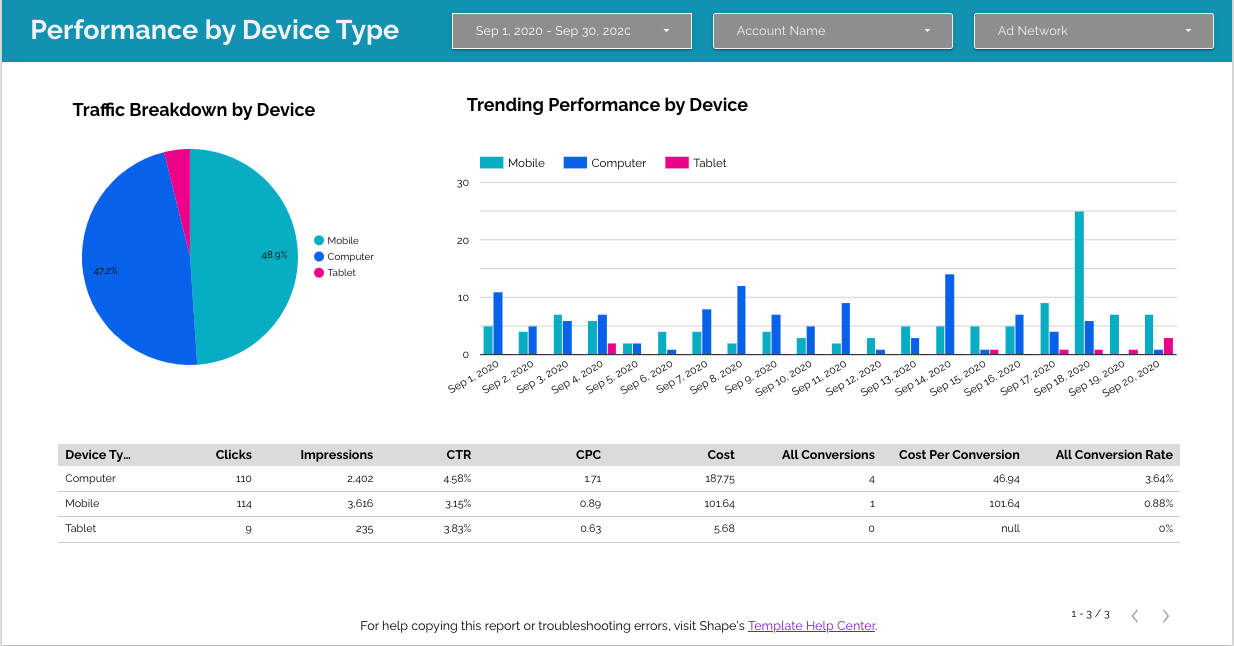
Our example PPC Performance Audit combines three performance reports with two settings/systems checks. For the Device, Search Terms, and Ad Type performance reports, we followed the steps below:
2. In Data Studio, select “Add a Chart” and select table or pivot table.
3. Add the appropriate data source as indicated by the name of the view.
4. Set a date range dimension of “date” or “timestamp” (this allows you to segment your report by time frames such as days or a range of days.
5. Depending on the audit type, select the dimension(s) you want to segment results by.
a. Device Performance Report =device
b. Search Terms Audit = search term & search term status
c. Performance by Ad Type = ad type
6. Select the metrics you wish to see broken out by the dimensions you set. This includes adding formulas for any “Calculated Metrics” you wish to include.
a. Example: We wanted to view traffic and conversions broken out by our various segments, so we added metrics such as clicks, impressions, CTR, CPC, and all_conversions.
7. Add any filters, sorting methods, or styling to your data tables using the Data and Style tabs in Data Studio’s editing mode.
8. Add “data controls” to help further segment data at the top level. For example, we used “Account Name” as a control on all audit templates. The template will default to showing data for all accounts but the control can be used to filter it to one (or a few) accounts at a time.
9. Optional: Data Studio offers many chart visualization types as well as data tables. We added bar and pie graph chart types (following the steps above to add data) to these reports where warranted. These different chart types can be used to visualize how performance is changing over time.
To create our system checks for # of Ads Per Ad Group and # of Ads Per Ad Set systems/settings checks, we followed a different process. Instead of looking at how certain targeting methods/elements performed, we wanted to see if our campaigns were meeting best practices. To do so, we wanted to see the count of active ads per ad group and ad set across all of our accounts so we could quickly determine which did not meet our “three ads per ad group/set” best practice.
2. In Data Studio, select “Add a Chart” and select table or pivot table.
3. Add the appropriate data source as indicated by the name of the view.
4. Depending on the audit type, select the dimension(s) you want to segment results by.
a. # of Ads Per Ad Group = campaign name, ad group name, ad type
b. # of Ads Per Ad Set = campaign name, ad set name, and ad type
5. Identify metrics that indicate an ad or campaign element is active.
a. Example: ad platforms generate a unique ID for each ad added to a campaign and ad group/ad set. We chose to count the number of unique “code_ad”s as our metric.
6. Add any filters, sorting methods, or styling to your data tables using the Data and Style tabs in Data Studio’s editing mode.
a. Example: We filtered to show only ads with an active status so that we didn’t count removed or paused ads.
7. Add “data controls” to help further segment data at the top level as needed.
8. Optional: Utilize conditional formatting or different chart types to quickly highlight campaigns that do not meet best practices and need to be addressed.
As a fair warning, for the average PPC advertiser, it may take some trial and error to get the audit working as you envisioned it. We kept our audit fairly simple in order to ensure a similar template could be replicated without ever leaving Google Data Studio.
If you’d like to complete more complex data audits and/or blend data views before importing into Data Studio, you can create new views in your Google BigQuery data warehouse using advanced SQL queries. (Note: If you have questions about this, we offer consulting with our engineering team as part of our Starter and Enterprise ADI offerings.)
Schedule Recurring Audits
Once you have finalized your audit templates, you’re done! (Well almost). Data from the Shape ADI is updated daily or more frequently depending on your tier. This means you can jump into your audit whenever you’d like to get the most up-to-date results for your ad accounts. Data will automatically refresh with the most recent data each time you open the audit.
We suggest scheduling time at regular intervals to check on your account audit to ensure campaigns are on track and performing as expected. Google Data Studio also offers the ability to email your audit at regular frequencies to yourself or stakeholders. To do so, click +Share, then “Schedule Email Delivery.” Enter details such as your recipients and repetition frequency and click “Schedule.”
Optimize
You’ve automated your common audit tasks and gained back hours you used to spend aggregating data. But audits are no good unless you’re using them to take action.
Now, when your audit flags an issue you can quickly adjust campaign settings and targeting as needed to course correct. And, if you’ve implemented an ADI PPC reporting solution along with your audit tool, you can use them in tandem to ensure campaign performance stays healthy over time.
Start Automating PPC Audits with Shape’s Advertising Data Infrastructure
We believe that every digital advertiser should be able to create and customize PPC tools utilizing all of their ad platform data without requiring costly engineering projects. With Shape’s ADI, every digital advertising team has cross-channel PPC data and a powerful data warehouse right at his or her fingertips.
To help make it easier to analyze and audit your PPC data, we have made campaign-level warehousing and API access free.
Looking for more data views or interested to learn more about what you can build with a data warehouse? Don’t hesitate to schedule a free consultation with our engineering team today before diving in.