How to Transfer LinkedIn Ads Data into Google BigQuery
LinkedIn Ads has emerged as a powerful advertising platform for digital advertisers due to its ability to uniquely target audiences based on their professions and career paths. Education, professional associations, current company, job titles, and seniority are all unique targeting points that advertisers can use to reach very specific industry and niche audiences.
As such, the ad platform is quickly gaining popularity amongst digital advertising agencies as an important piece of clients’ (especially B2B and SaaS) multi-platform advertising strategies.
While ads have been displayed on LinkedIn since 2005, it’s only in the last 5 years that the ad platform has gained traction thanks to improvements in its UI, and the addition of more targeting methods and ad types. The ease of use of the platform has grown leaps and bounds, but for agencies managing lots of clients, scaling reporting and account optimization remains time consuming.
Harnessing LinkedIn Ads account performance data at scale is possible with Google BigQuery. Similar to the Microsoft Ads data transfer and the Facebook Ads data transfer, there is no automatic, first-party connector from LinkedIn Ads to Google BigQuery. Therefore, to generate a LinkedIn data warehouse and populate it with data, we suggest these three ways that any digital advertiser can use (regardless of their technical/coding skills):
- 1. Manual LinkedIn Ads Data Upload
- 2. Data Pipelines and Connectors
- 3. Shape’s Advertising Data Infrastructure
Manual LinkedIn Ads Data Upload into BigQuery
While very manual, it is possible for digital advertisers to build their own LinkedIn Ads data warehouses without engineering resources or expansive software budgets. Google BigQuery allows you to manually import data from a CSV file directly. This means that any digital advertiser that can download a LinkedIn Ads report can upload it to their very own data warehouse.
The cost of building this solution manually is affordable. Uploading LinkedIn Ads data is free although costs accumulate if a digital advertiser suprasses Google’s data querying and storage thresholds. However, manually updating LinkedIn Ads data regularly across multiple different report types can get cumbersome. Likewise, when manually uploading LinkedIn Ads data, digital advertisers want to be sure that their reports contain the same data schema (metrics, headings, and data formats) to prevent incomplete or missing data from quickly destroying the usefulness of their data warehouse.
Directions:
1. Generate a Google Cloud Project (free trial available).
2. You’ll be taken to a “Basic Checklist.” (You’ve already completed steps 1 and 2 listed.)
3. Navigate to Google BigQuery and find your new project. Note: a generic project name is created for you. You can edit the project name in the Settings tab.
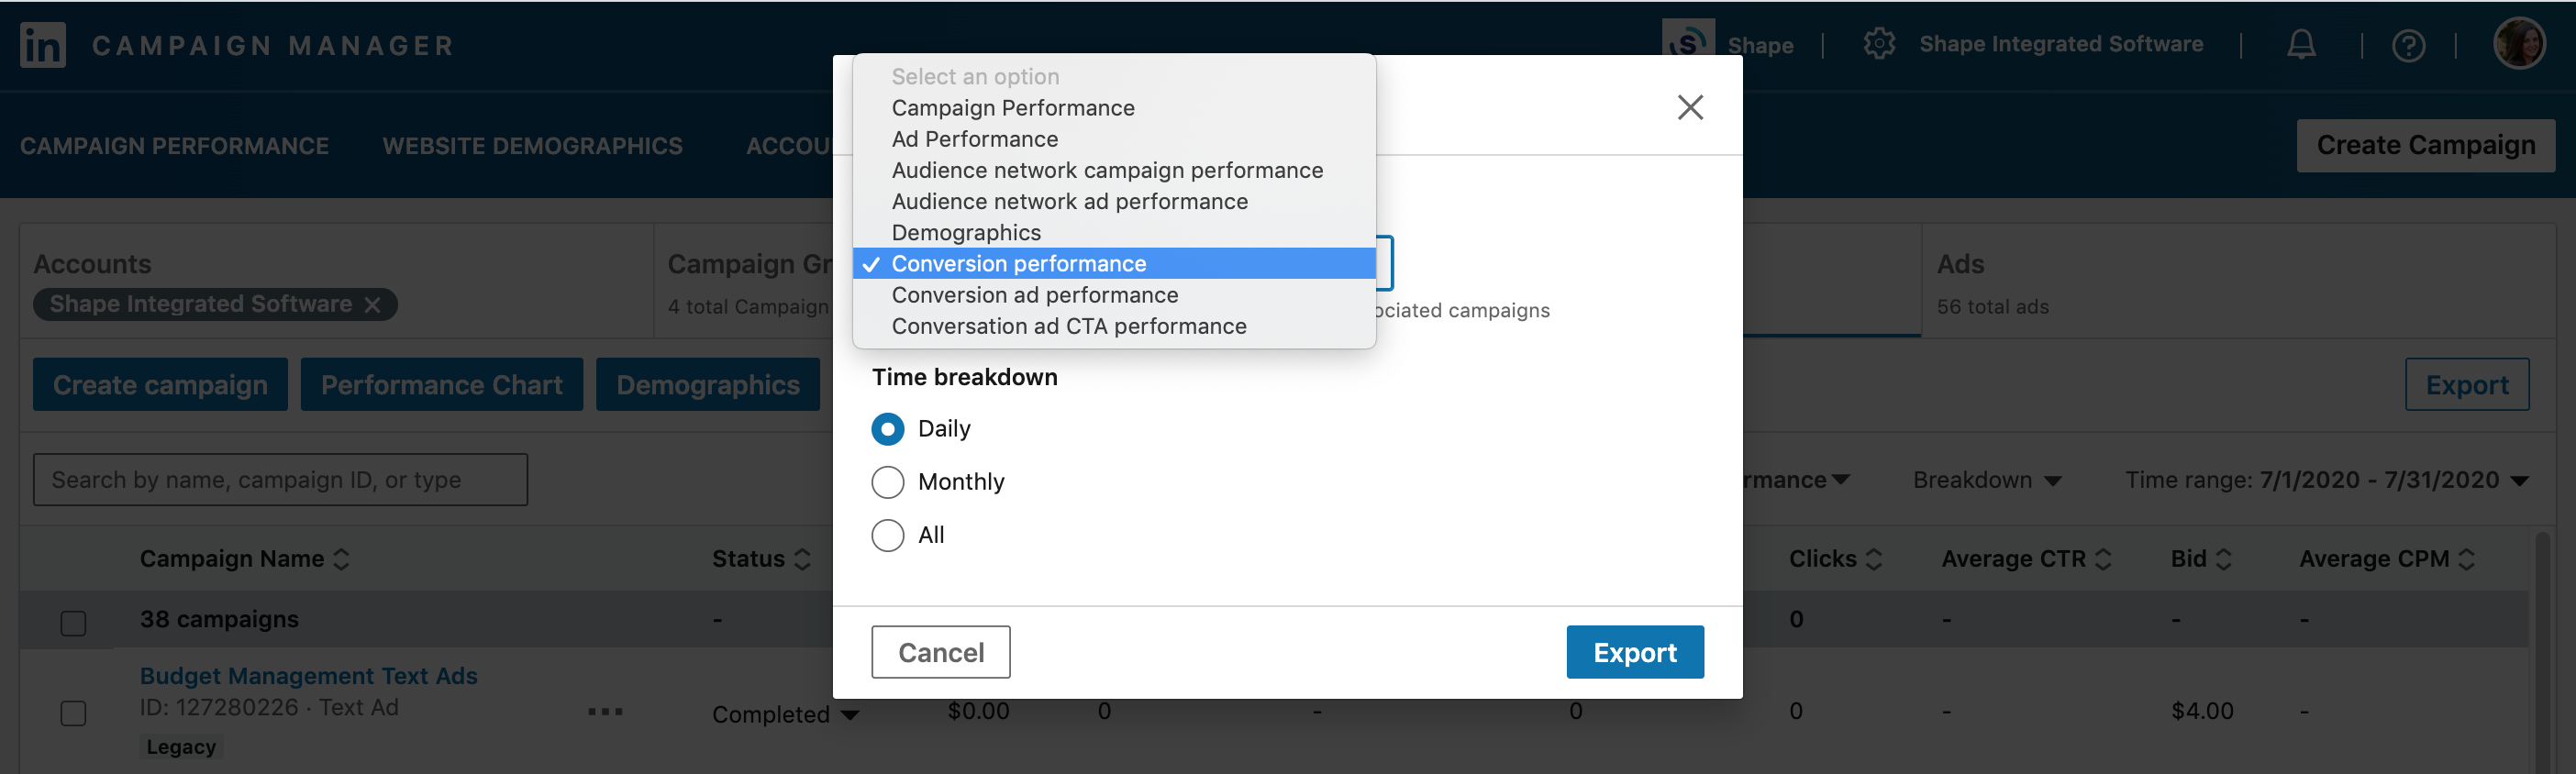
4. Login to LinkedIn Ads and navigate to the client you wish to analyze. In the upper right-hand corner, click export to download a .CSV.
- a. Select from one of the 8 report types available: Campaign Performance, Ad Performance, Audience Network Campaign Performance, Audience Network Ad Performance, Demographics, Conversion Performance, Conversion Ad Performance, or Conversion Ad CTA Performance
- b. Select a time frame of daily, monthly, or all.
- c. Export.
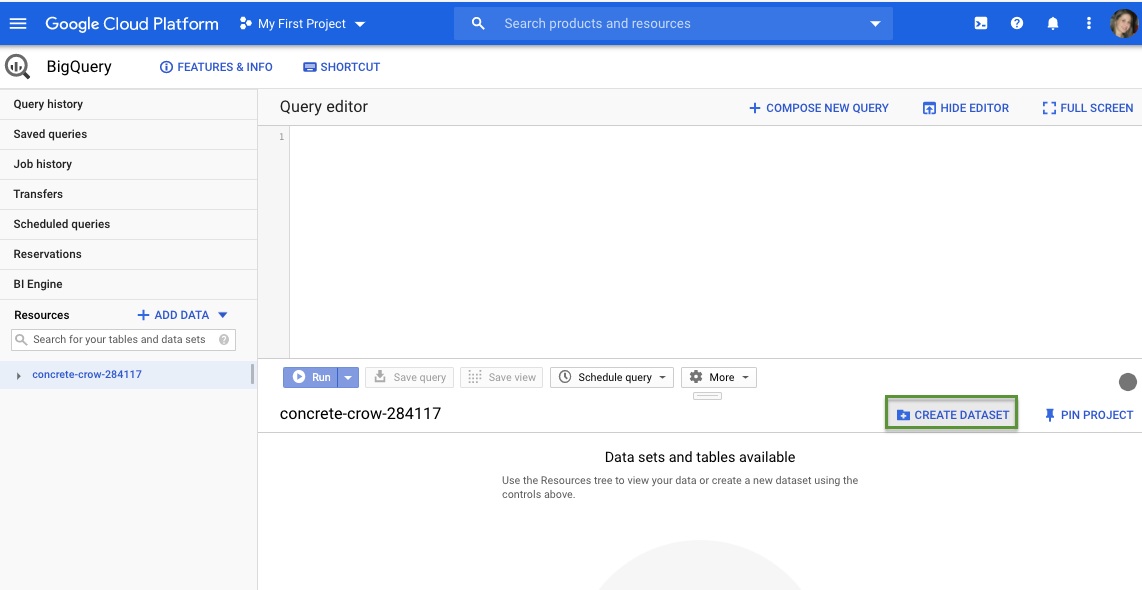
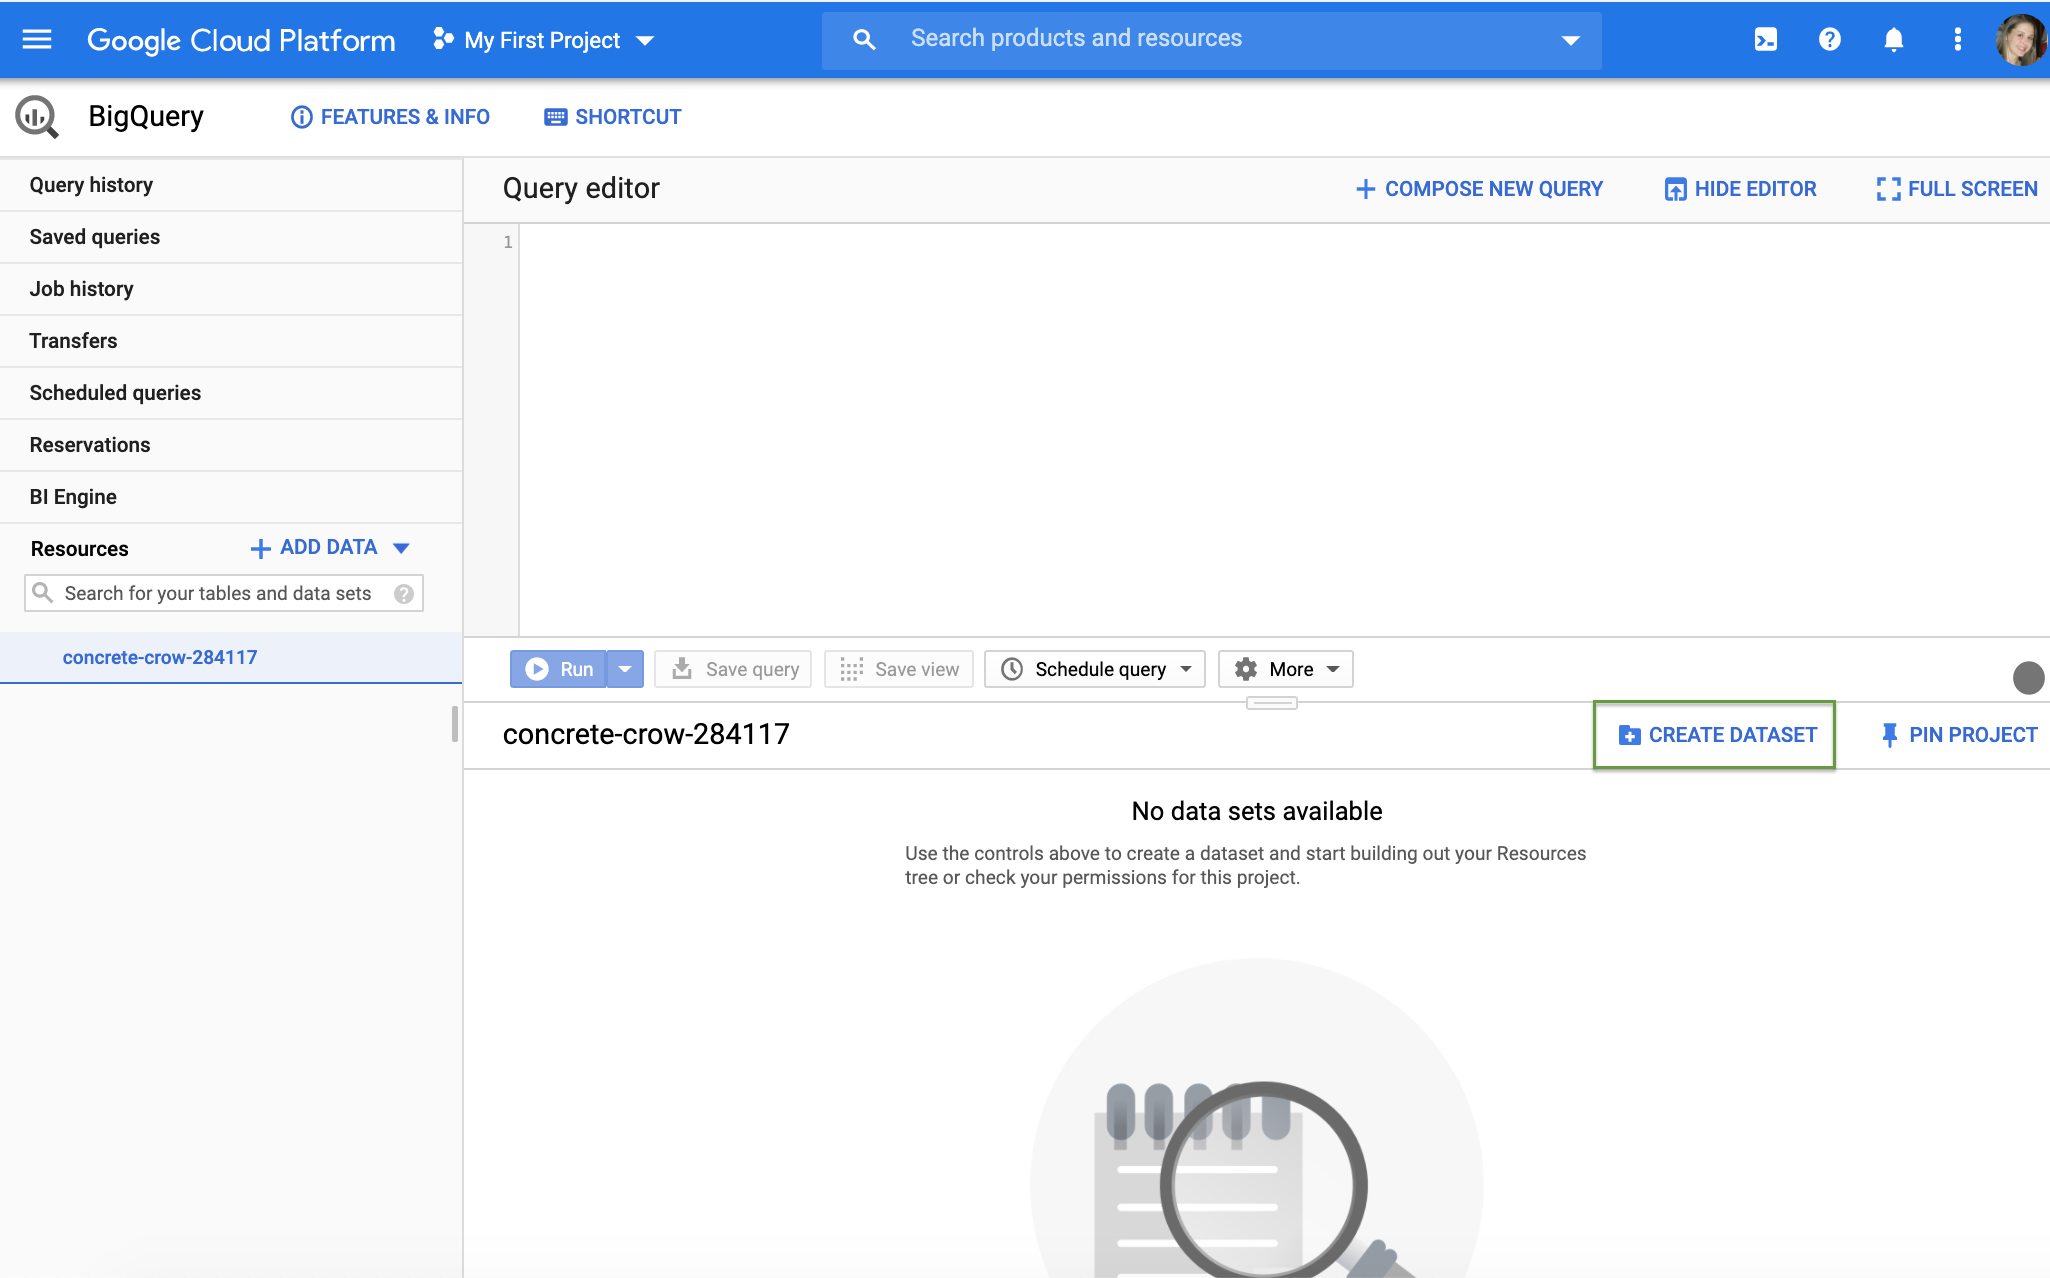
5. Navigate back to Google BigQuery. Ensure your project is selected at the top of the screen and then click your project ID in the left-hand navigation.
6. Click “+Create Dataset”
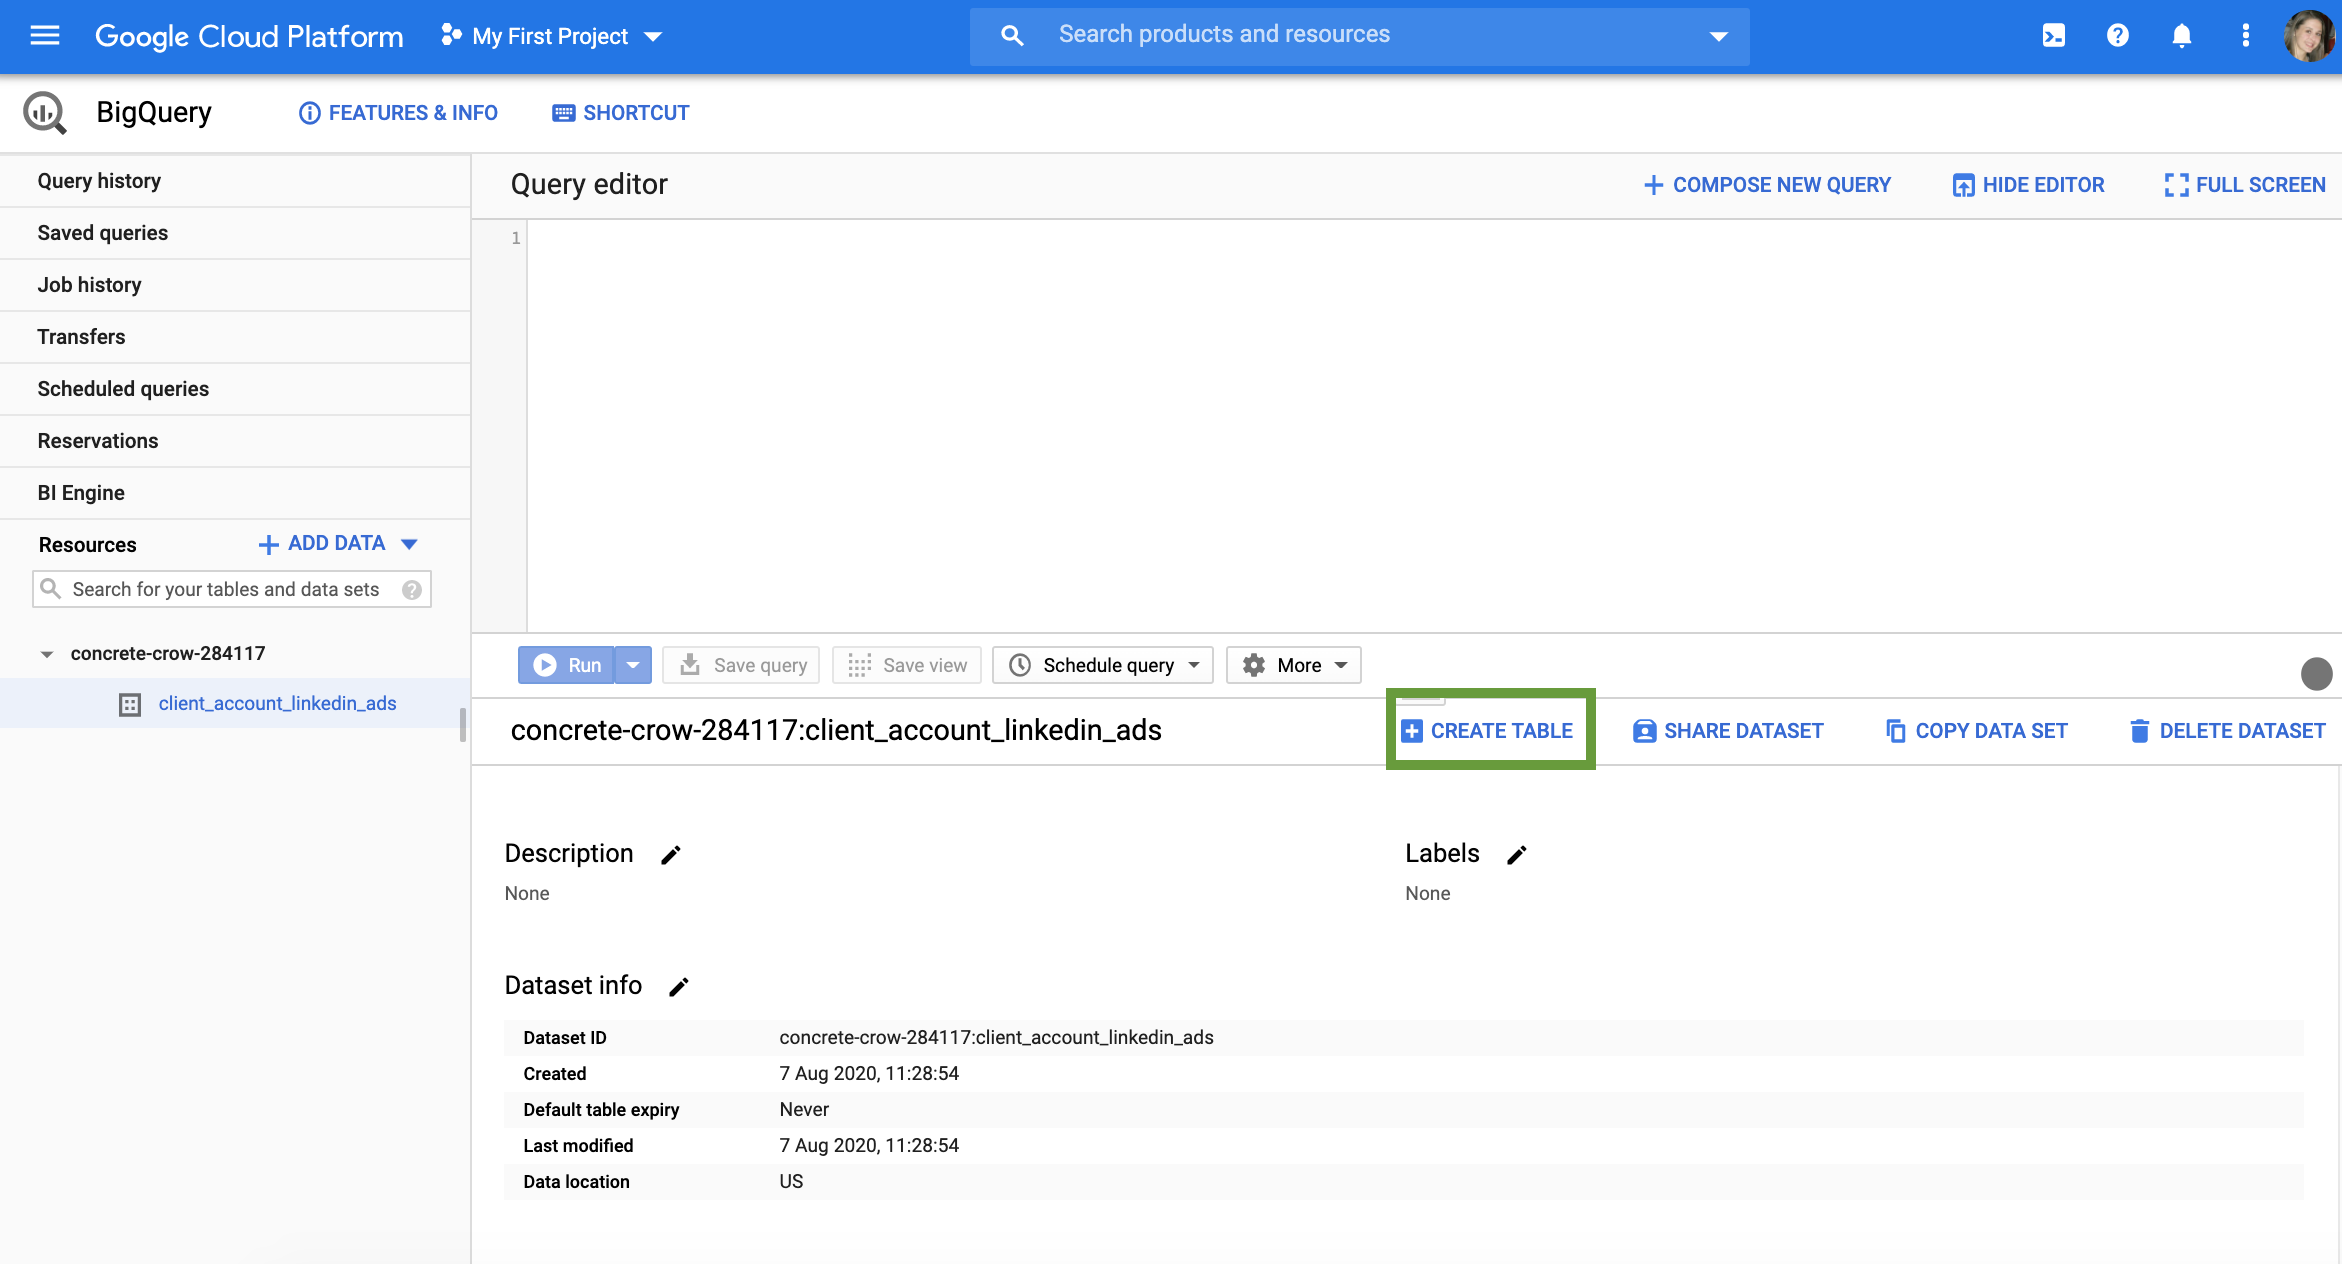
7. Name your dataset. This should be representative of the entire dataset you plan to include (ex: “client_account_linkedin_ads”).
8. Ensure an encryption method is set then click “Create dataset.”
9. Click the name of your new dataset in the left-hand navigation and click “+Create Table”.
10. Navigate to the Source section.
- a. Create table from: Upload
- b. Select file: Find your LinkedIn Ads report you saved using the browse button
- c. File format: CSV
11. Navigate to the Destination section.
- a. Select “Search for a project.”
- b. Find your project name from the dropdown. Then select your dataset name (created in step 7).
- c. Enter a name for your table. This should be representative of the table of data you are uploading (ex: campaign_data_segmented_by_month)
12. Navigate to the Schema section.
- a. Click the checkbox to allow BigQuery to auto-detect schema OR
- b. Click “Edit as text” to manually name schema, set type (string, boolean, date, etc.), and mode (nullable, required or repeated).
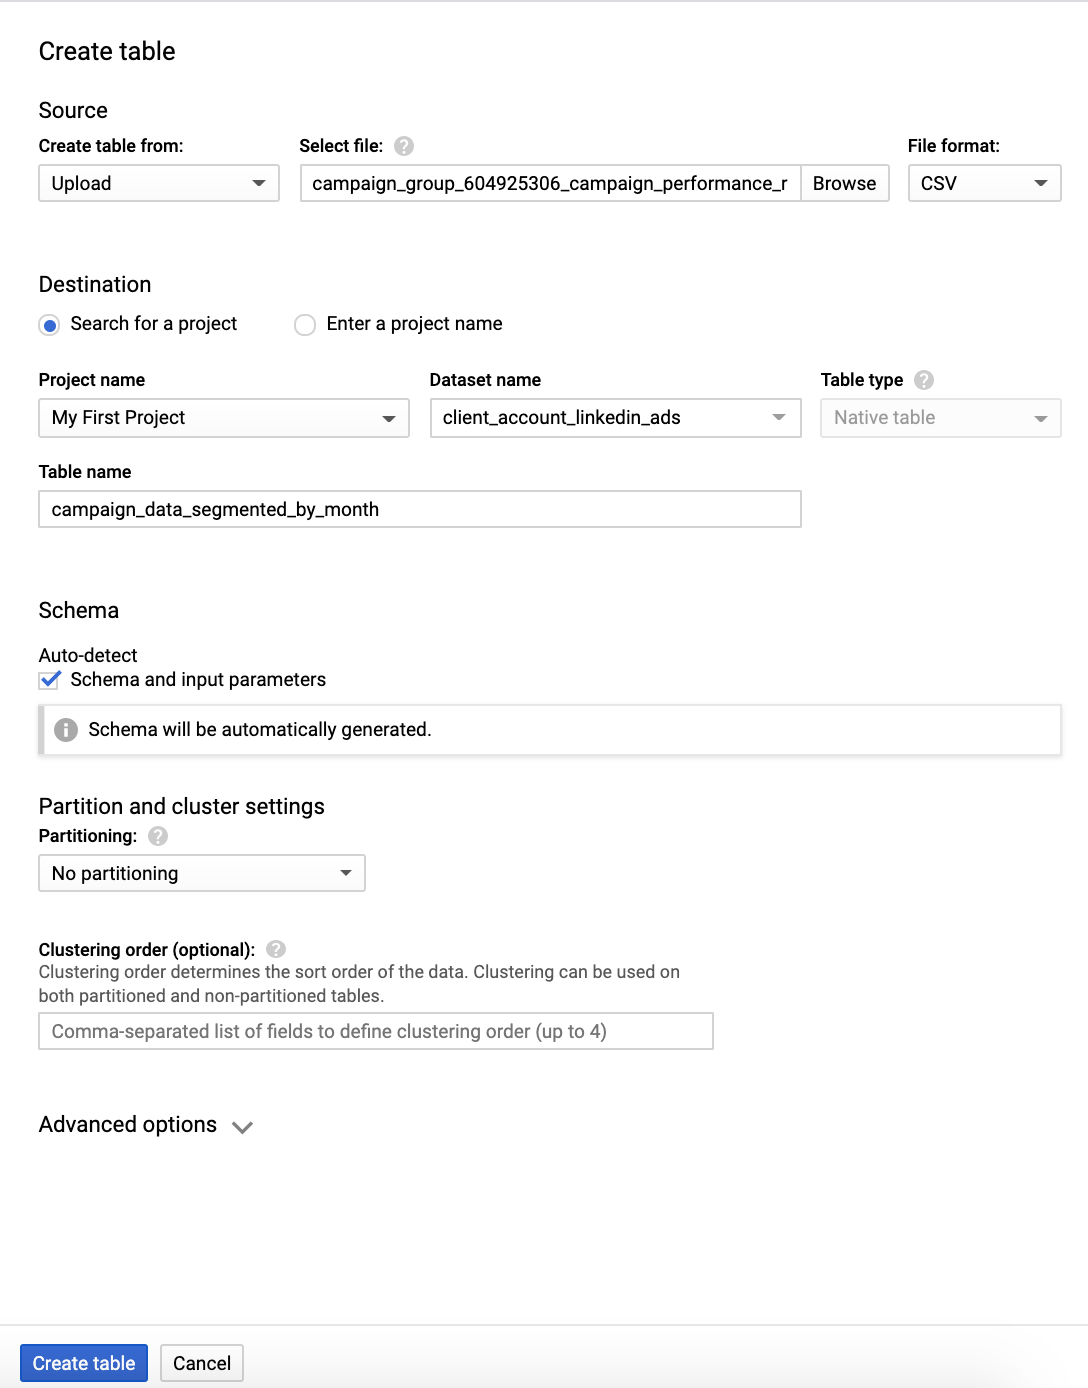
13. Navigate to the Partition and cluster settings section.
- a. Choose “No partitioning” or “Partition by ingestion time” based on your needs. Partitioning divides your table into smaller segments that allow smaller sections of data to be more quickly and affordably queried.
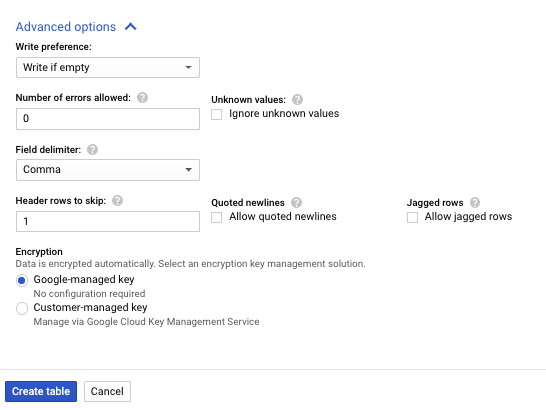
14. Navigate to Advanced Options:
- a. Set Field delimiter: Comma
- b. If your data includes a header row, enter 1 in the “Header Rows to skip” field.
15. Click “Create table.” Your data warehouse will now begin to populate with LinkedIn Ads data. Check your Job History for the status of your data load.
16. Navigate to Google BigQuery and click your Dataset ID.
17. You can now start writing SQL queries against your LinkedIn Ads data in Google BigQuery, or export your data to Google Data Studio and other third-party tools for further analysis.
18. Repeat this process for all additional LinkedIn Ads data sets you wish to upload.
19. Repeat this process on a regular basis to ensure fresh data is available when necessary.
Google offers fantastic guides on manually uploading data to Google BigQuery or using JSON, as well as extensive support documentation.
Using Data Pipelines/Connectors to Get LinkedIn Ads Data into BigQuery
Another alternative to populate a Google BigQuery data warehouse with LinkedIn Ads data is to use a third-party data pipeline or connector. Several solutions exist such as Supermetrics, Funnel, and Improvado. With each of these solutions, the advertiser is responsible for launching, managing, and paying for the data warehouse. The connectors/pipelines transfer LinkedIn Ads data to the data warehouse on a preset basis. Depending on the solution, pricing may fluctuate based on the number of LinkedIn Ads accounts and/or data sources linked, the frequency or size of data transfers, or the level of support needed.
Although we can’t cover spin up directions for each connector individually, we’ve selected SuperMetrics for BigQuery given that Supermetrics is used by many PPC advertisers.
Directions:
1. Sign up for a free trial of Supermetrics for BigQuery (note: there is a free trial but access may not be granted immediately).
2. Add your LinkedIn Ads data sources to Supermetrics.
3. Generate a Google Cloud Project (free trial available).
4. You’ll be taken to a “Basic Checklist.” You’ve already completed steps 1 and 2. Click step 3: find “Product + API.” This takes you to the Google Cloud Platform Marketplace.
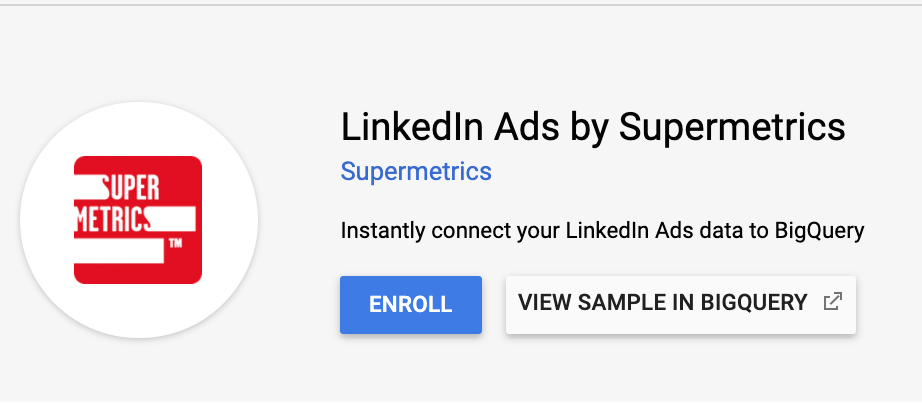
5. Search/select “LinkedIn Ads by Supermetrics.” Click Enroll.
6. Select the name of the project you generated in steps 3 & 4. Note: a generic project name is created for you. You can edit the project name in the Settings tab.
7. Navigate to BigQuery and click your project name on the left-hand navigation.
8. Click “Create Dataset.” Fill out a dataset ID and location as needed. Save.
9. Using the left-hand navigation again, click Transfers. Select +Create Transfer.
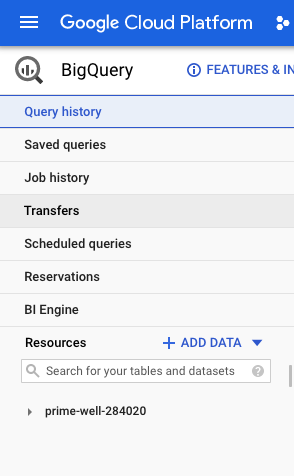
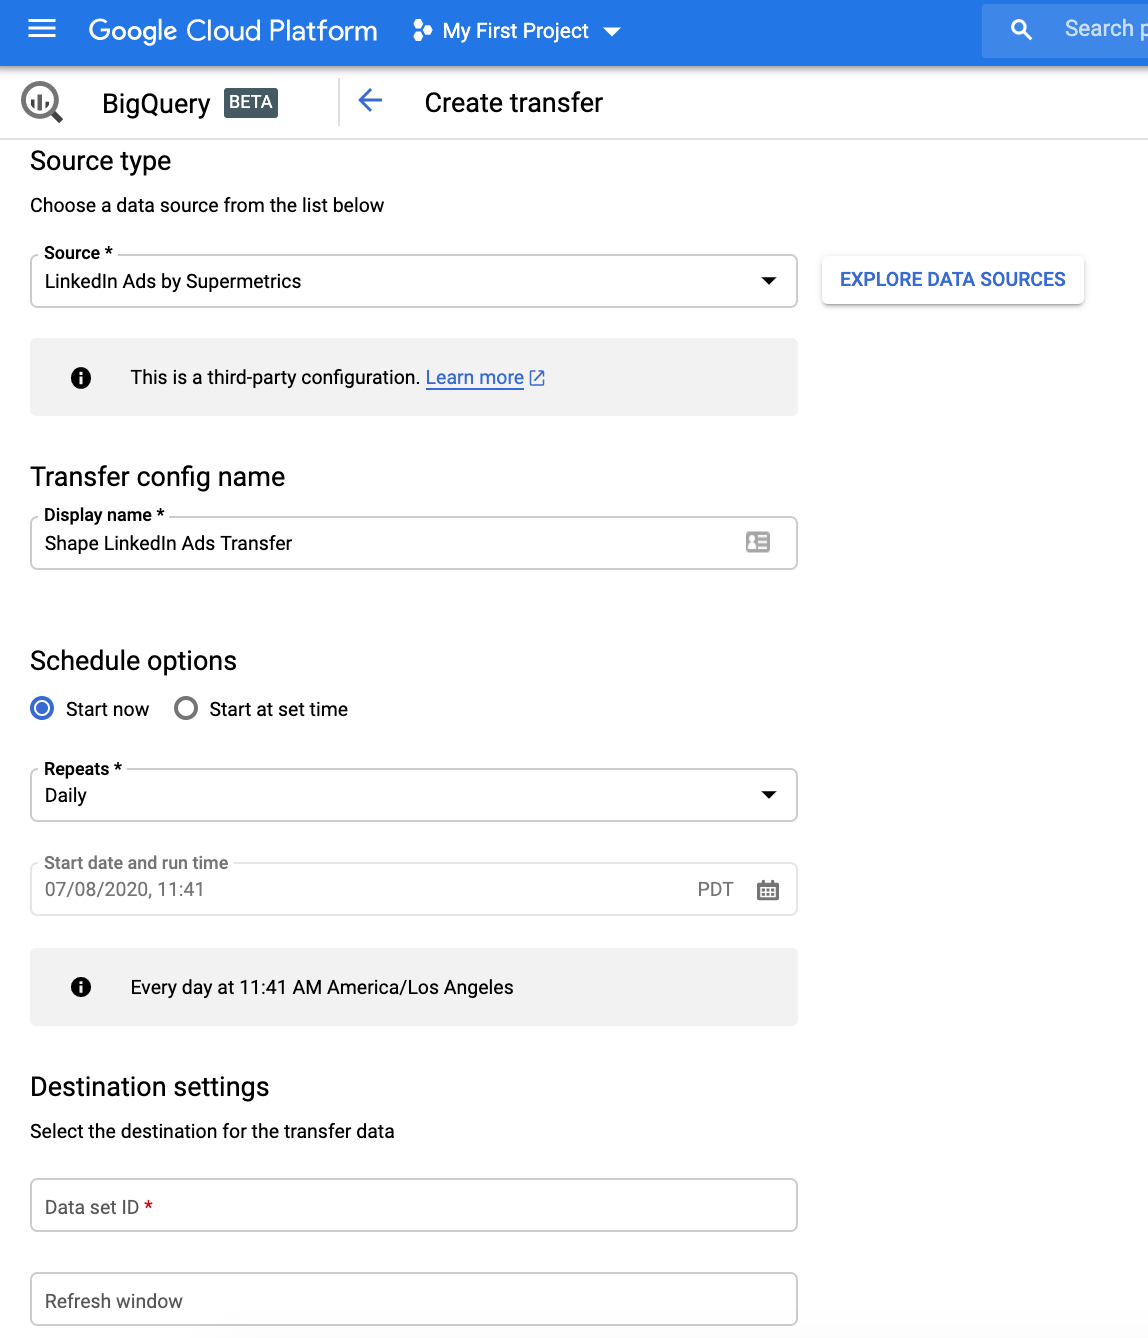
10. You’ll be asked to configure the transfer form.
11. Set the Source to “LinkedIn Ads by Supermetrics”
12. Set Transfer Config Name = Name this something that indicates the job being run. (Ex: Shape LinkedIn Ads Transfer)
13. Set Schedule Options.
- a. Select what time you’d like data refreshed (Start Now or Start at set time)
- b. Select if you want data refreshed on a schedule or on-demand
- c. Select the start date and run time when data will be refreshed
14. Enter a Dataset ID = Choose (or create) a name for your dataset displayed in BigQuery.
- a. If creating a new Dataset ID, follow the steps on the “Create Dataset” form to add an ID name, data location, table expiration time, and encryption key. Give a clear indication of what’s included in the dataset (ex: Client Name LinkedIn Ads).
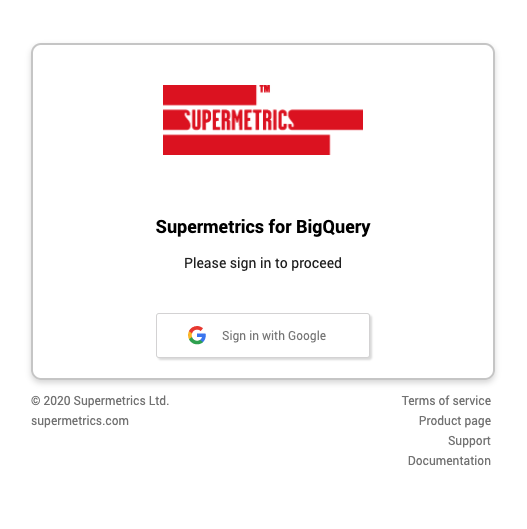
15. Under the Third-Party Connection section, click “Connect Source”. Follow steps to authorize Supermetrics as a third-party connector.
16. Using the Supermetrics pop up modal, sign in to Supermetrics for BigQuery. Authorize the LinkedIn Ads login as needed.
17. Select the ad accounts you wish to transfer data from and submit.
18. Your data warehouse will now begin to populate with data. Once the data has successfully been run, you can navigate back to BigQuery to access your data.
19. IMPORTANT: To backfill historical data, you’ll need to follow additional steps outlined in Supermetrics support documentation.
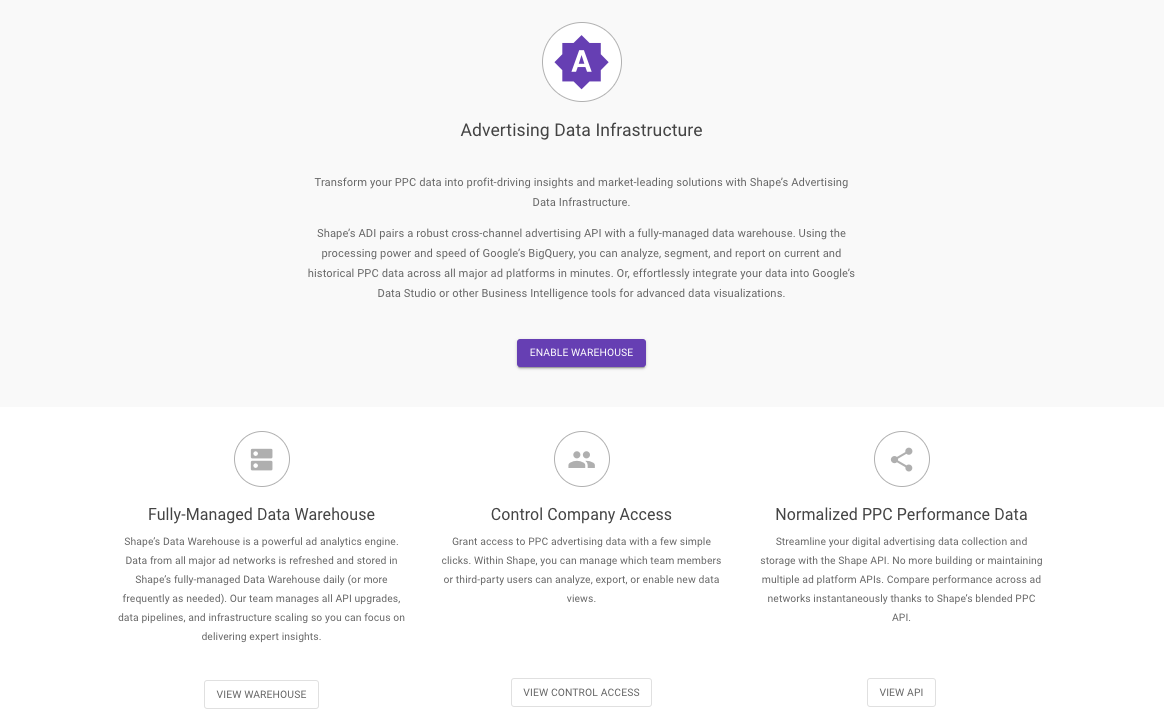
Using Shape’s Advertising Data Infrastructure to get LinkedIn Ads Data into BigQuery
We designed the Shape ADI to be the fastest and easiest way for digital advertisers to generate and populate a new BigQuery data warehouse with LinkedIn Ads data. Shape manages the Google Cloud Platform and dataset spinups, the data transfer, and even backfills data for 30 days (more can be requested). Likewise, Shape’s ADI makes it easy to access and analyze cross-client data as opposed to uploading and querying each client individually.
Everyone who spins up an ADI gets access to five campaign-level data views for free, and Shape handles the cost of data storage and queries. If advertisers want to enable premium views, pricing scales based on the number of views enabled (instead of on the number of data sources or ad accounts needed which can get expensive fast for agencies).
Directions:
2. Add your LinkedIn Ads data sources during the onboarding process.
- a. Optional: Create Clients and Budgets in Shape. You can combine campaigns into unique groupings to track spend and metrics in whichever combinations you choose.
3. On the main dashboard, click ADI. On the ADI page, click “Enable Warehouse.”
4. Shape will automatically generate a BigQuery data warehouse for you and enable five always-free campaign-level data views.
5. Once your data warehouse has been generated and 30-days worth of data backfilled, you’ll be taken to the Data Warehouse that lists all available data views.
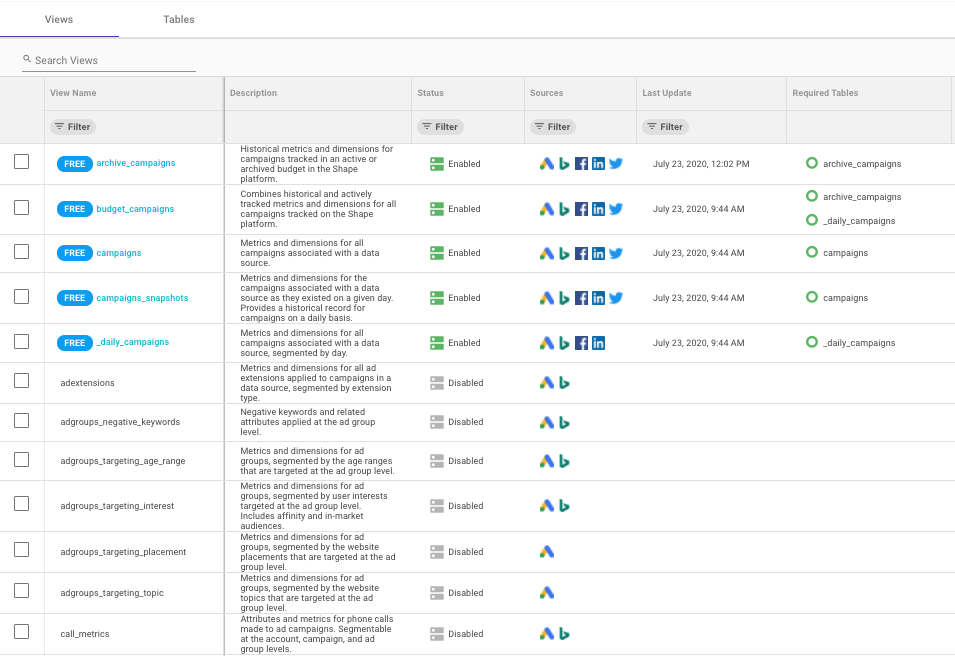
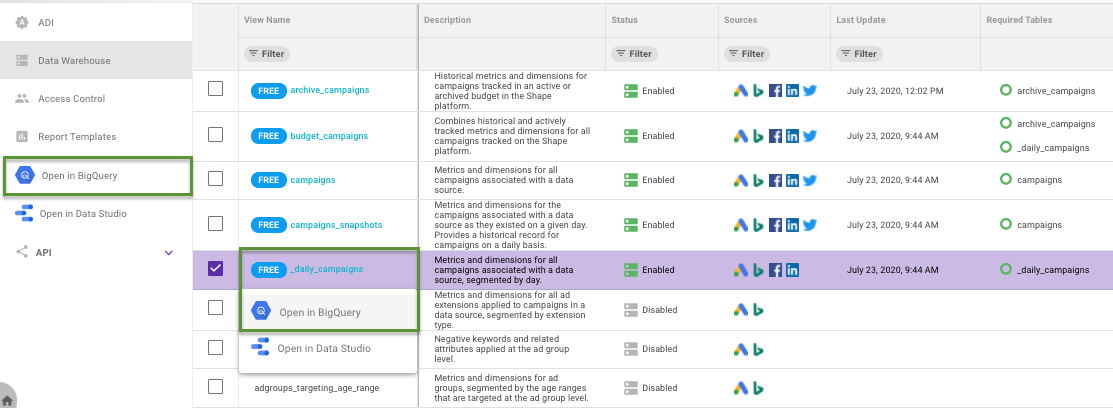
6. Select a View Name to open that view directly in BigQuery OR click the “Open in BigQuery” to access your entire BigQuery data warehouse.
7. Your data warehouse is already populated and backfilled with data. You can query your data in BigQuery or export it to tools such as Google Data Studio and other third-party tools.
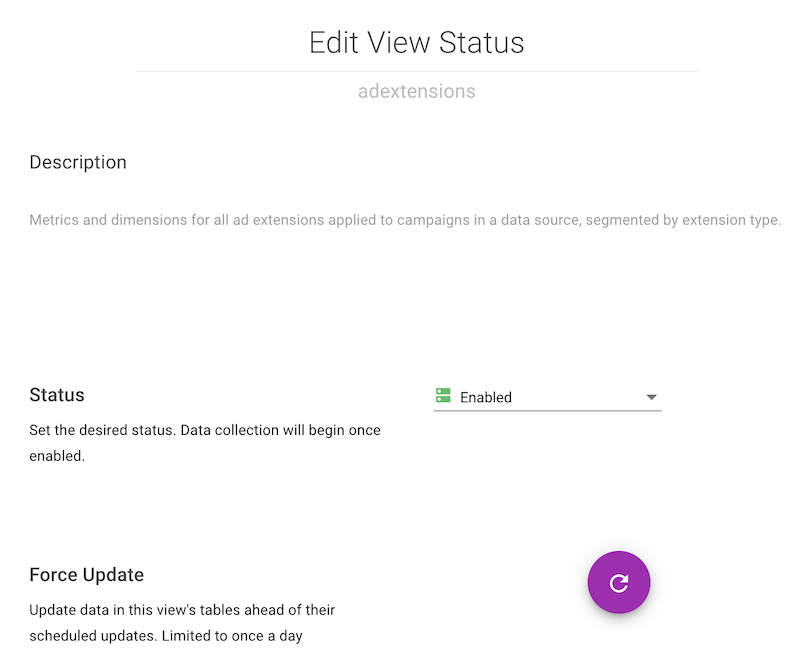
8. Optional: If you want to enable premium views, click the checkbox next to a premium view. Click the pencil that appears at the top of the table.
- a. On the “Edit View Status” screen, change the Status to “Enabled.”
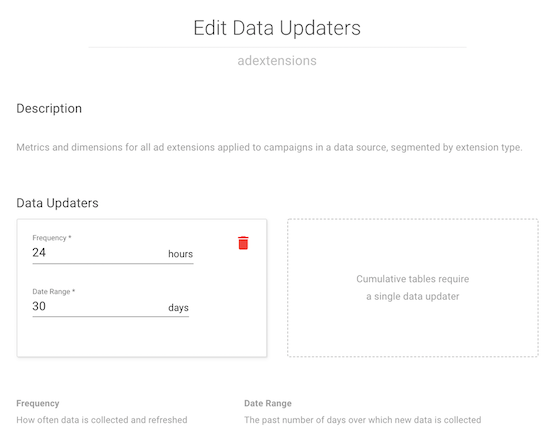
- b. Click into the tables tab and use the pencil icon to edit the view. You can change the Updaters to how frequently Shape refreshes data and the length of data the view includes in the refresh.
- c. Click “Save Settings.”
For additional detail on Shape’s ADI including data warehouse support, check out Shape’s Help Center.
Getting Started with Shape’s Managed PPC Data Warehouse
We believe that every digital advertiser should have a powerful data PPC warehouse at her or his fingertips. To help make it easier to access and analyze your data, we have made campaign-level warehousing and API access free.
Looking for more data views or interested to learn more about what you can build with a data warehouse? Don’t hesitate to schedule a free consultation with our engineering team today before diving in.